Technical Analysis: Using Charts and Indicators to Make Better Investment Decisions
This is the 10th chapter of my blog series on the Stock market, In which you will learn about the Indian Stock Market from the very basic to the professional level. Keep learning.

Welcome back to our series, "Understanding the Indian Stock Market: A Beginner's Guide." In this tenth installment, we will explore the fundamentals of technical analysis. Technical analysis involves studying past market data, primarily price and volume, to forecast future price movements. By mastering technical analysis, you can enhance your ability to make informed investment decisions.
What is Technical Analysis?
Technical analysis is a method used to evaluate and predict the future price movements of securities by analyzing historical price charts and trading volumes. Unlike fundamental analysis, which focuses on a company's financial health and economic factors, technical analysis is purely based on market data.
Key Concepts in Technical Analysis
1. Price Charts
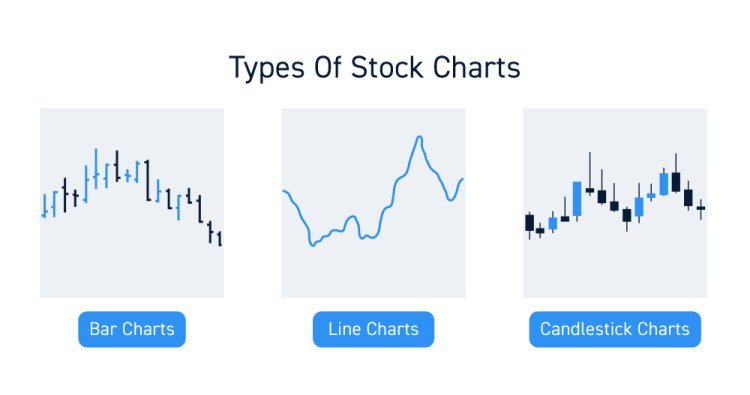
Price charts are graphical representations of a security's price movements over time. They are the primary tools used in technical analysis.
a. Line Chart
A line chart connects closing prices over a specified period, providing a clear view of the overall price trend.
- Example: A line chart showing the closing prices of a stock over the past year.
b. Bar Chart
A bar chart displays the opening, high, low, and closing prices (OHLC) for a security over a specified period. Each bar represents one period.
- Example: A bar chart showing daily price movements of a stock for one month.
c. Candlestick Chart
A candlestick chart provides the same information as a bar chart but in a more visually appealing format. Each "candlestick" represents one period and shows the opening, high, low, and closing prices.
- Example: A candlestick chart displaying the daily price movements of a stock.
Key Indicators in Technical Analysis
Technical indicators are mathematical calculations based on price, volume, or open interest that are used to identify trends, momentum, volatility, and other aspects of price movement.
1. Moving Averages
Moving averages smooth out price data to identify the direction of the trend. They can be simple moving averages (SMA) or exponential moving averages (EMA).
- Example: A 50-day SMA is calculated by averaging the closing prices of the last 50 days.
a. Simple Moving Average (SMA)
SMA is calculated by taking the average of a security's closing prices over a specific period.
- Example: A 10-day SMA calculated by adding the closing prices of the past 10 days and dividing by 10.
b. Exponential Moving Average (EMA)
EMA gives more weight to recent prices, making it more responsive to new information.
- Example: A 10-day EMA that adjusts more quickly to recent price changes than a 10-day SMA.
2. Relative Strength Index (RSI)
RSI is a momentum oscillator that measures the speed and change of price movements on a scale of 0 to 100. It helps identify overbought and oversold conditions.
- Example: An RSI above 70 indicates overbought conditions, while an RSI below 30 indicates oversold conditions.
3. Moving Average Convergence Divergence (MACD)
MACD is a trend-following momentum indicator that shows the relationship between two moving averages of a security's price. It consists of the MACD line, signal line, and histogram.
- Example: A bullish signal occurs when the MACD line crosses above the signal line.
4. Bollinger Bands
Bollinger Bands consist of a middle band (SMA) and two outer bands (standard deviations). They measure volatility and identify overbought and oversold conditions.
- Example: Prices touching the upper band may signal overbought conditions, while touching the lower band may signal oversold conditions.
Chart Patterns
Chart patterns are specific formations created by the price movements of a security. They help predict future price movements based on historical patterns.
1. Head and Shoulders
The head and shoulders pattern indicates a reversal of a trend. It consists of three peaks: a higher peak (head) between two lower peaks (shoulders).
- Example: A head and shoulders pattern forming after an uptrend suggests a possible reversal to a downtrend.
2. Double Top and Double Bottom
The double-top pattern indicates a bearish reversal, while the double-bottom pattern indicates a bullish reversal.
- Example: A double top forming after an uptrend suggests a potential trend reversal to the downside.
3. Triangles
Triangles are continuation patterns that indicate a period of consolidation before the price continues in the direction of the previous trend. They can be ascending, descending, or symmetrical.
- Example: An ascending triangle forming during an uptrend suggests the price may continue rising.

Practical Example
Let’s apply technical analysis concepts to a hypothetical scenario:
Scenario: Analyzing XYZ Ltd.
- Price Chart: Use a candlestick chart to analyze XYZ Ltd.'s price movements over the past year.
- Moving Averages: Apply a 50-day SMA and 200-day SMA to identify the overall trend.
- Observation: The 50-day SMA is above the 200-day SMA, indicating an uptrend.
- RSI: Check the RSI to identify overbought or oversold conditions.
- Observation: The RSI is at 75, suggesting overbought conditions.
- MACD: Analyze the MACD for momentum signals.
- Observation: The MACD line has crossed below the signal line, indicating a potential bearish signal.
- Chart Patterns: Look for any recognizable chart patterns.
- Observation: A head and shoulders pattern is forming, suggesting a possible trend reversal.
Conclusion
Technical analysis is a valuable tool for investors looking to understand and predict market movements. By mastering key concepts like price charts, technical indicators, and chart patterns, you can make more informed and strategic investment decisions. Remember to use technical analysis in conjunction with other methods, such as fundamental analysis, to build a well-rounded investment strategy.
Stay tuned for our next blog in the series, where we'll explore fundamental analysis and how to evaluate a company's financial health to make better investment decisions.
I hope this blog helps you understand the basics of technical analysis. Feel free to leave your questions or comments below and happy investing!


